How to Plot Total Ozone Column Time-series with DSCOVR and Pandora Data
How to Plot Total Ozone Column Time-series with DSCOVR and Pandora Data
Description:
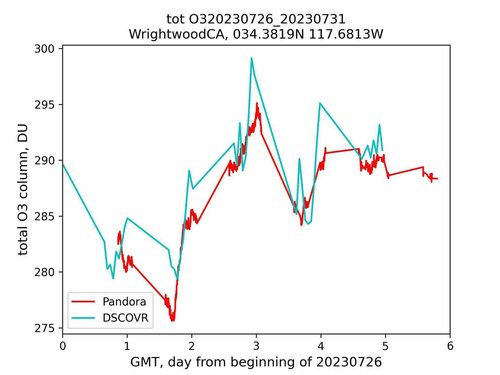
The code provided plots three different versions of total ozone column timeseries from DSCOVR_EPIC_L4_TrO3 and Pandora data. The code allows a user to select a Pandora station of interest and input the desired timeframe. DSCOVR EPIC data covering the location of the selected Pandora station and timeframe are downloaded on the fly using the earthaccess library. Both Pandora and DSCOVR EPIC data are read to form timeseries.
The time series is first plotted without the uncertainties of Pandora retrievals, which are added in the second version of the plot. This version is usually messy, as there are many more Pandora retrievals than EPIC ones. For this reason, Pandora measurements (along with their uncertainties) are averaged (smoothed) to the times of EPIC measurements. This makes both time series directly comparable. The result is plotted in the third version of the graph.
Data:
DSCOVR_EPIC_L4_TrO3_01
Pandora
Access the Notebook:
https://github.com/nasa/ASDC_Data_and_User_Services/blob/main/DSCOVR/DSCOVR_EPIC_L4_TrO3_vs_Pandora.py
